What the analyzer actually is
The Deal Analyzer is the room where you turn a property record into an offer. Open it from any property report by clicking Analyze / Underwrite at the top, or jump straight to /app/properties/<id>/calculator. The header reads "Investment Calculator & LOI/Contract Generator" — that's the actual job. You walk in with a property; you walk out with a signable Letter of Intent or Purchase Contract that has every number you just calculated baked in.
The reason this matters: investors usually run their numbers in a spreadsheet, then re-type them into a Word template, then re-type them again into an e-sign tool. Every hand-off loses fidelity and burns time. The analyzer collapses that into one surface. Eight tabs, one flow, one document at the end.
Start with acquisition strategy — because entry costs depend on it
The first tab is Acquisition Strategy and it's not there by accident. Your entry costs change dramatically based on how you're funding the deal, and every downstream number — cash-to-close, monthly payment, cash-on-cash return — depends on which strategy you pick. Get this wrong and you'll under-estimate the capital you actually need by six figures.
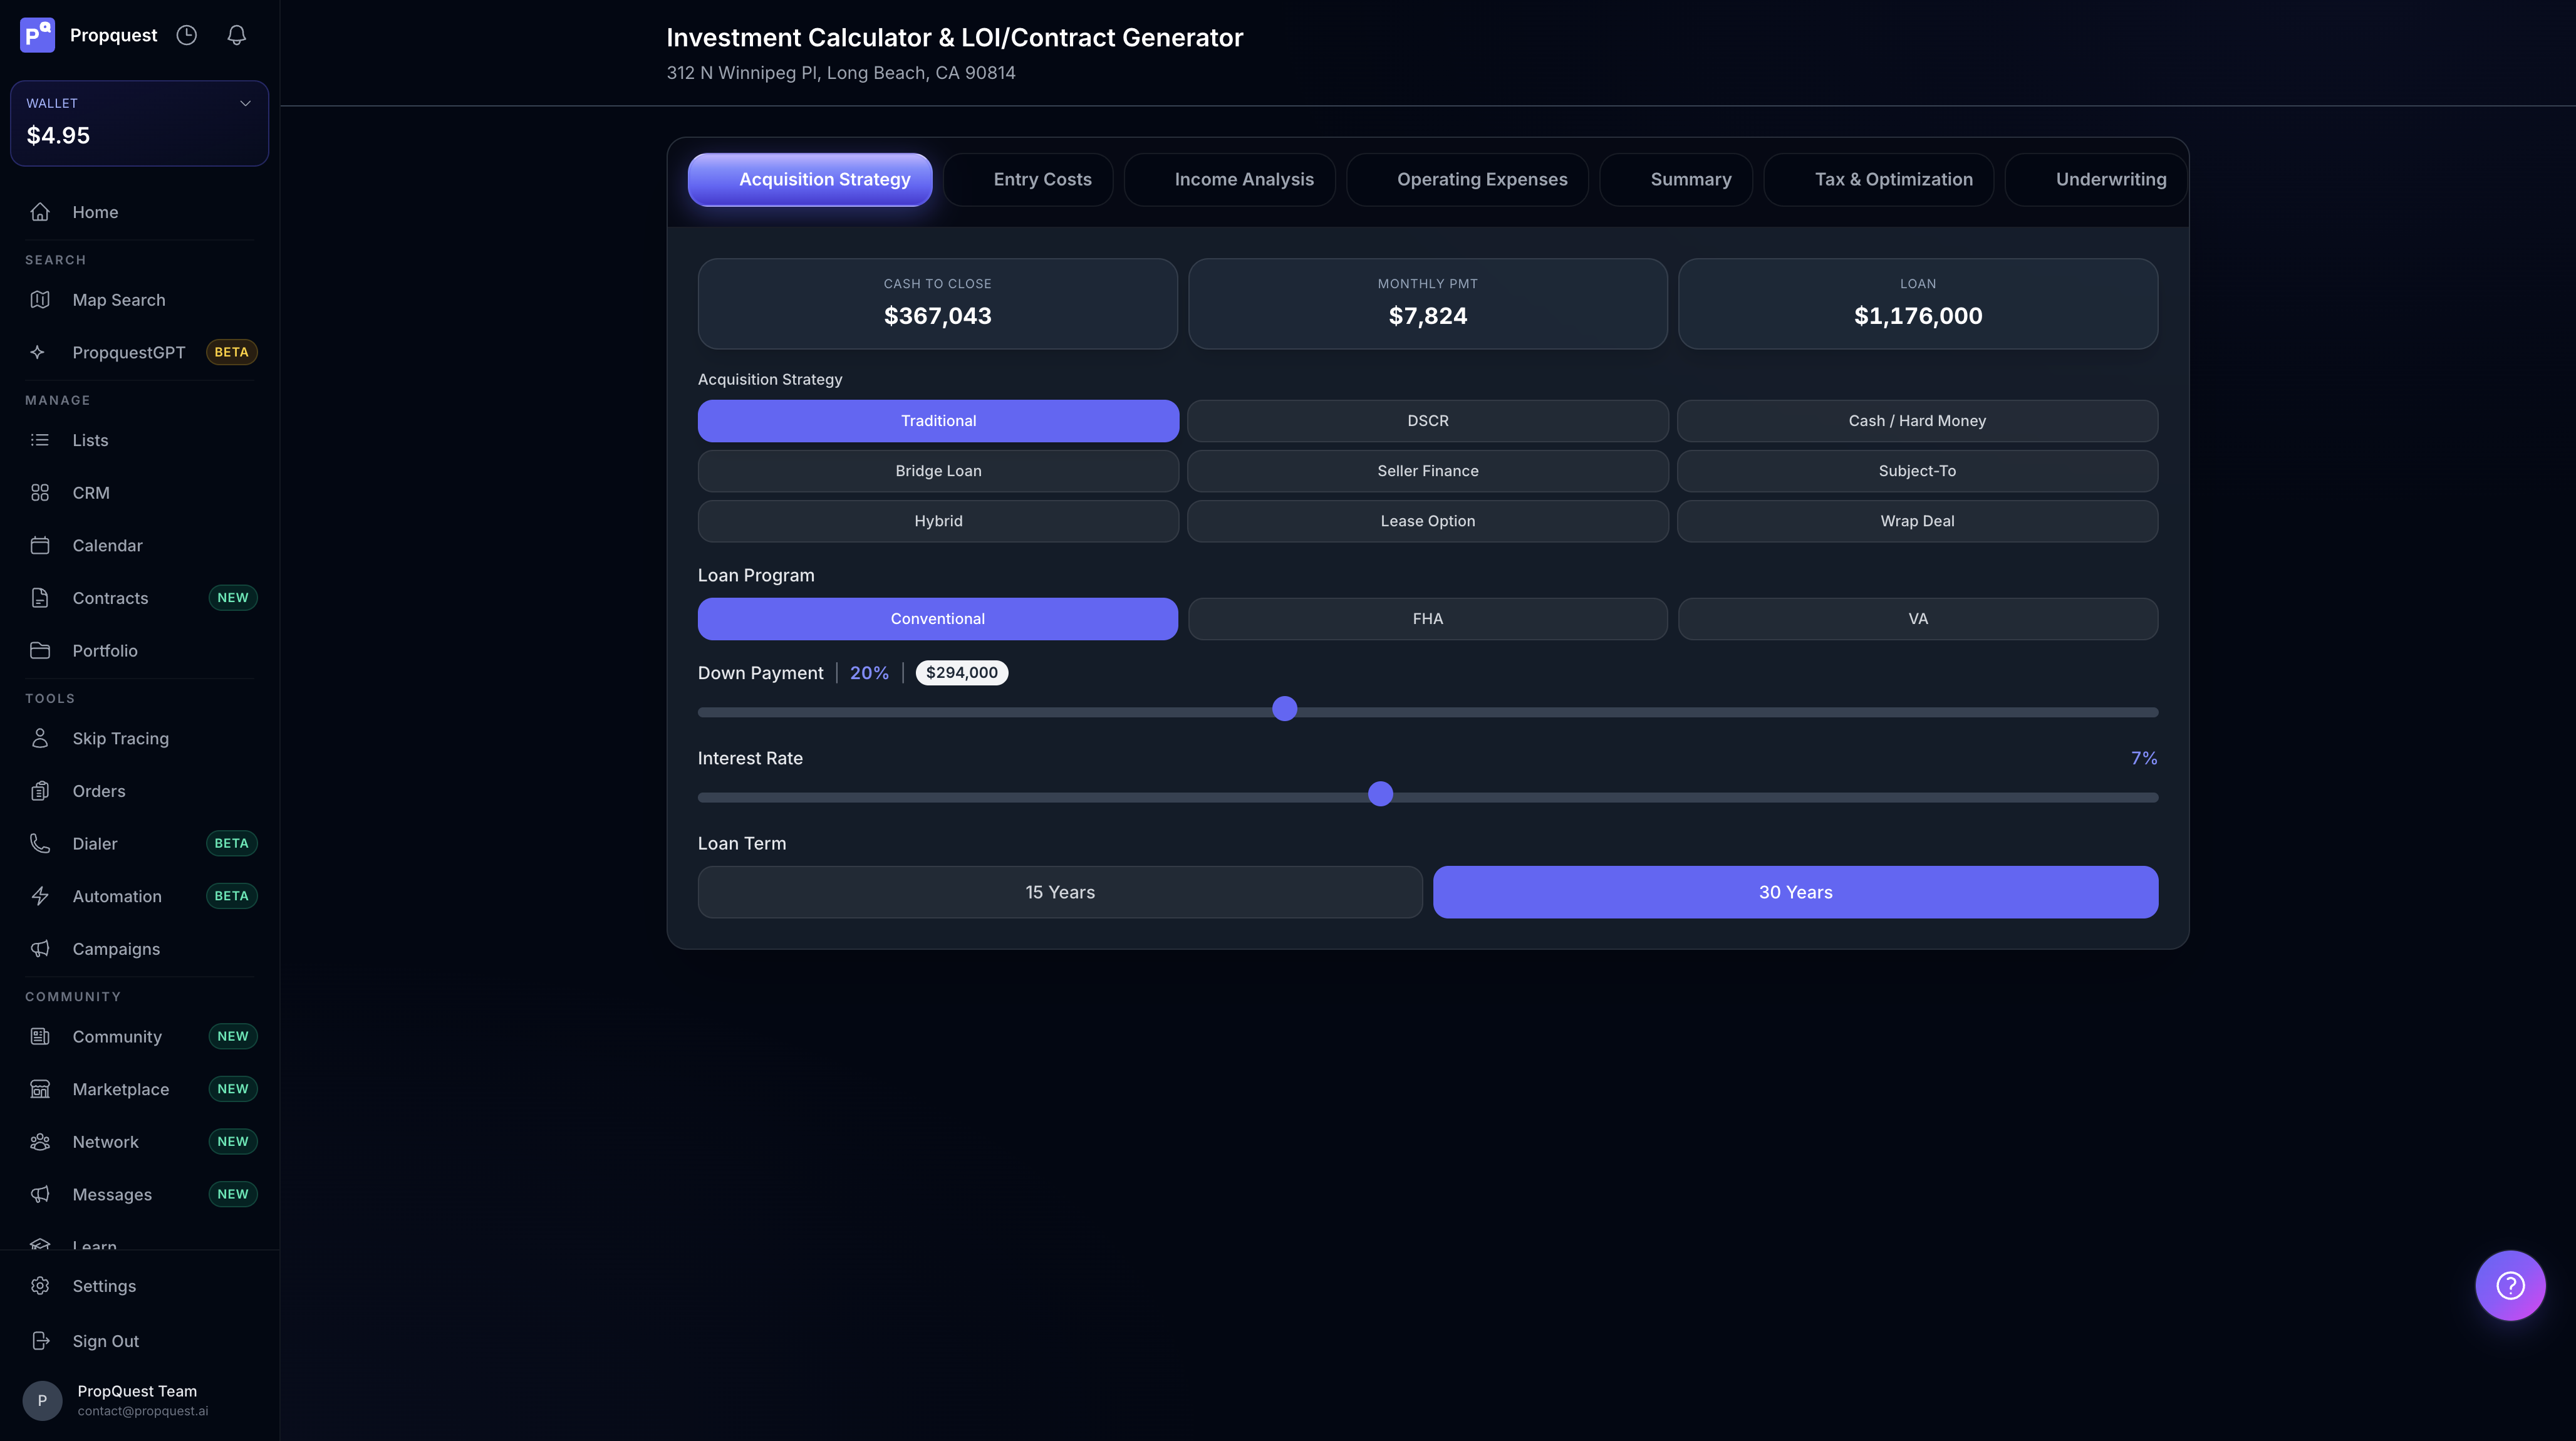
You get nine strategies side-by-side: Traditional, DSCR, Cash / Hard Money, Bridge Loan, Seller Finance, Subject-To, Hybrid, Lease Option, Wrap Deal. Each one rewires the entry-cost math. Traditional surfaces Conv/FHA/VA + down-payment slider + interest rate. DSCR uses rent-coverage instead of personal income. Cash zeros out the loan and front-loads the entry cost. Sub-To takes over the seller's existing mortgage so your cash-to-close drops to the equity gap. Seller Finance lets you model an interest rate the bank wouldn't touch. Pick the one you'd actually run on this deal — the rest of the analyzer recomputes from there.
The top KPI bar (Cash to Close, Monthly Payment, Loan Amount) updates live as you toggle. Watch it move. Switching from Traditional to Cash on this Long Beach 4-plex doubles your cash-to-close but kills the monthly payment — that's the trade you're really making.
Entry costs are where you stop lying to yourself
The Entry Costs tab is the line-item breakdown of what you're actually putting on the table. Down payment, cash to seller, closing costs, agent commission, renovation, holding costs, arrears/liens, assignment fee. Eight items. Most investors track three of them.
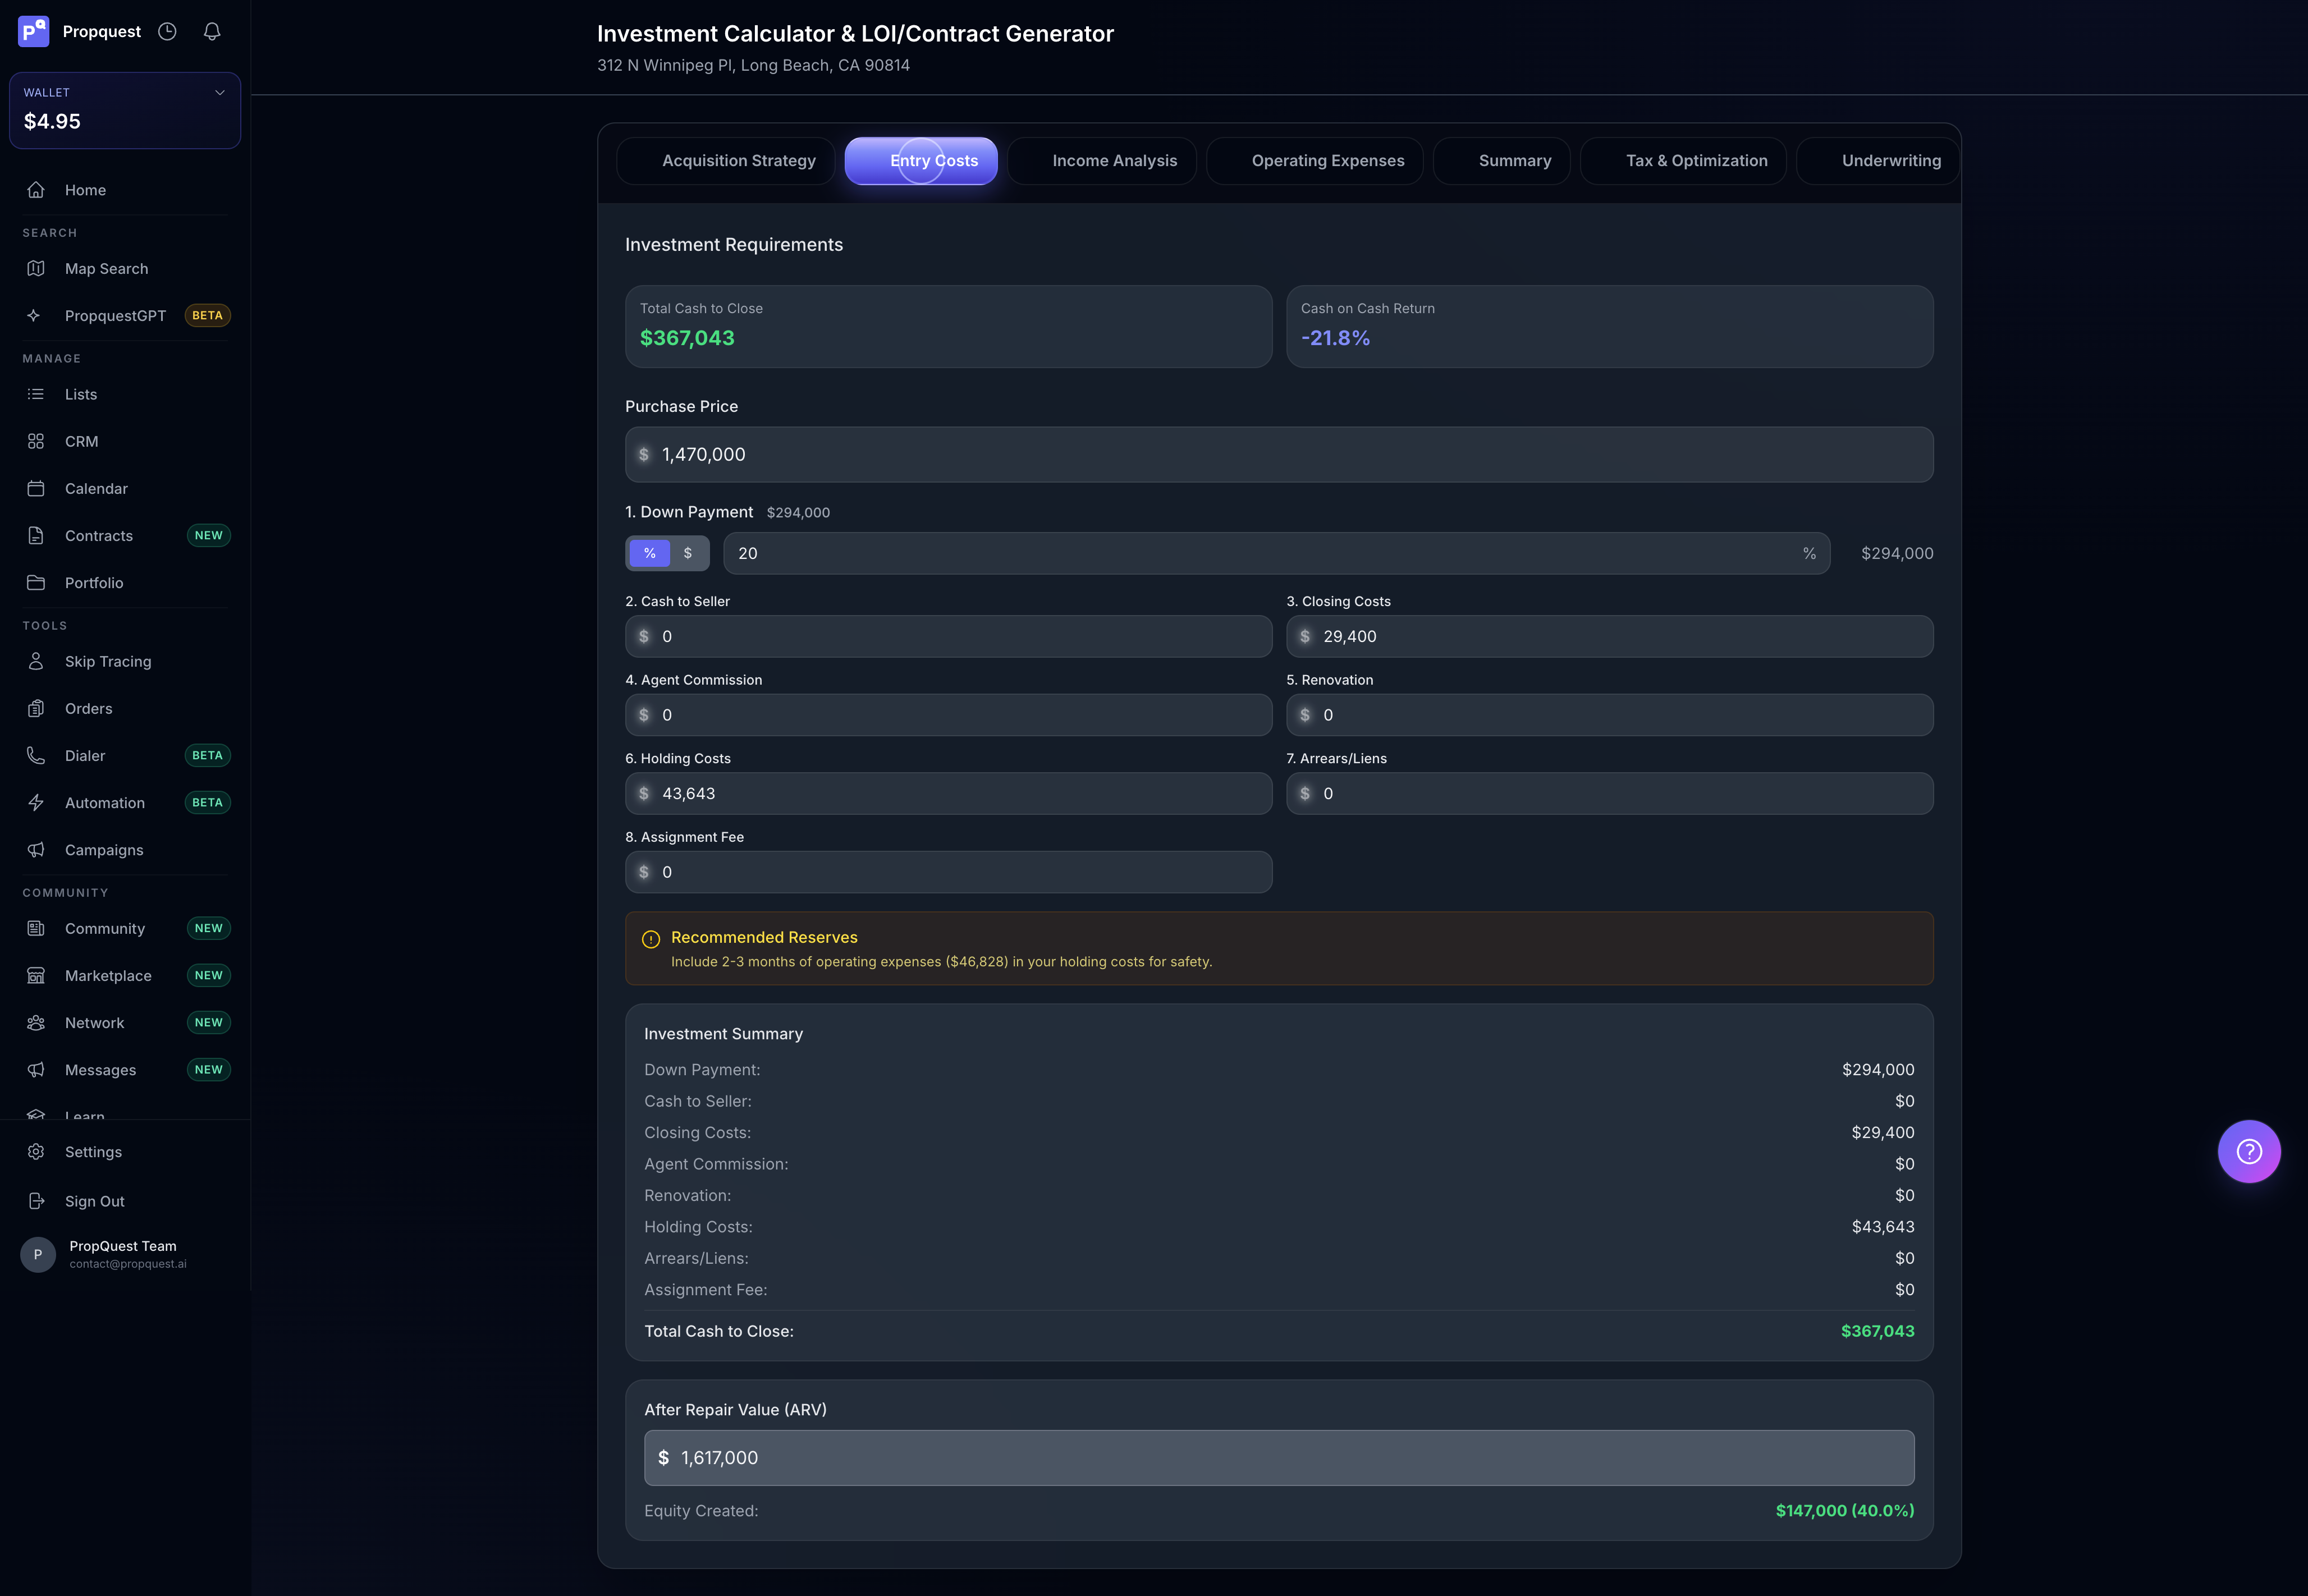
The two everyone forgets: holding costs and arrears/liens. Holding gets pre-filled with a 2-3-month operating-expense reserve recommendation — keep it. If you're buying a property with deferred taxes or a mechanic's lien, the Arrears/Liens field is where you bake that into the cash-to-close so it doesn't blindside you at closing. The ARV field at the bottom drives the equity-created math and feeds the Summary tab's MAO calculations downstream.
The Investment Summary panel on the right is the receipt — it sums what you've typed in, so if your total looks wrong, scan that list and find the line you fat-fingered. Most "this number is off" problems live there.
Pick your exit strategy
The Income Analysis tab is where you decide what you're doing with the property AFTER you own it. Same property can be a wholesale, a long-term rental, an Airbnb, a Section 8 hold, a BRRRR, or a novation — and the income math is completely different for each.
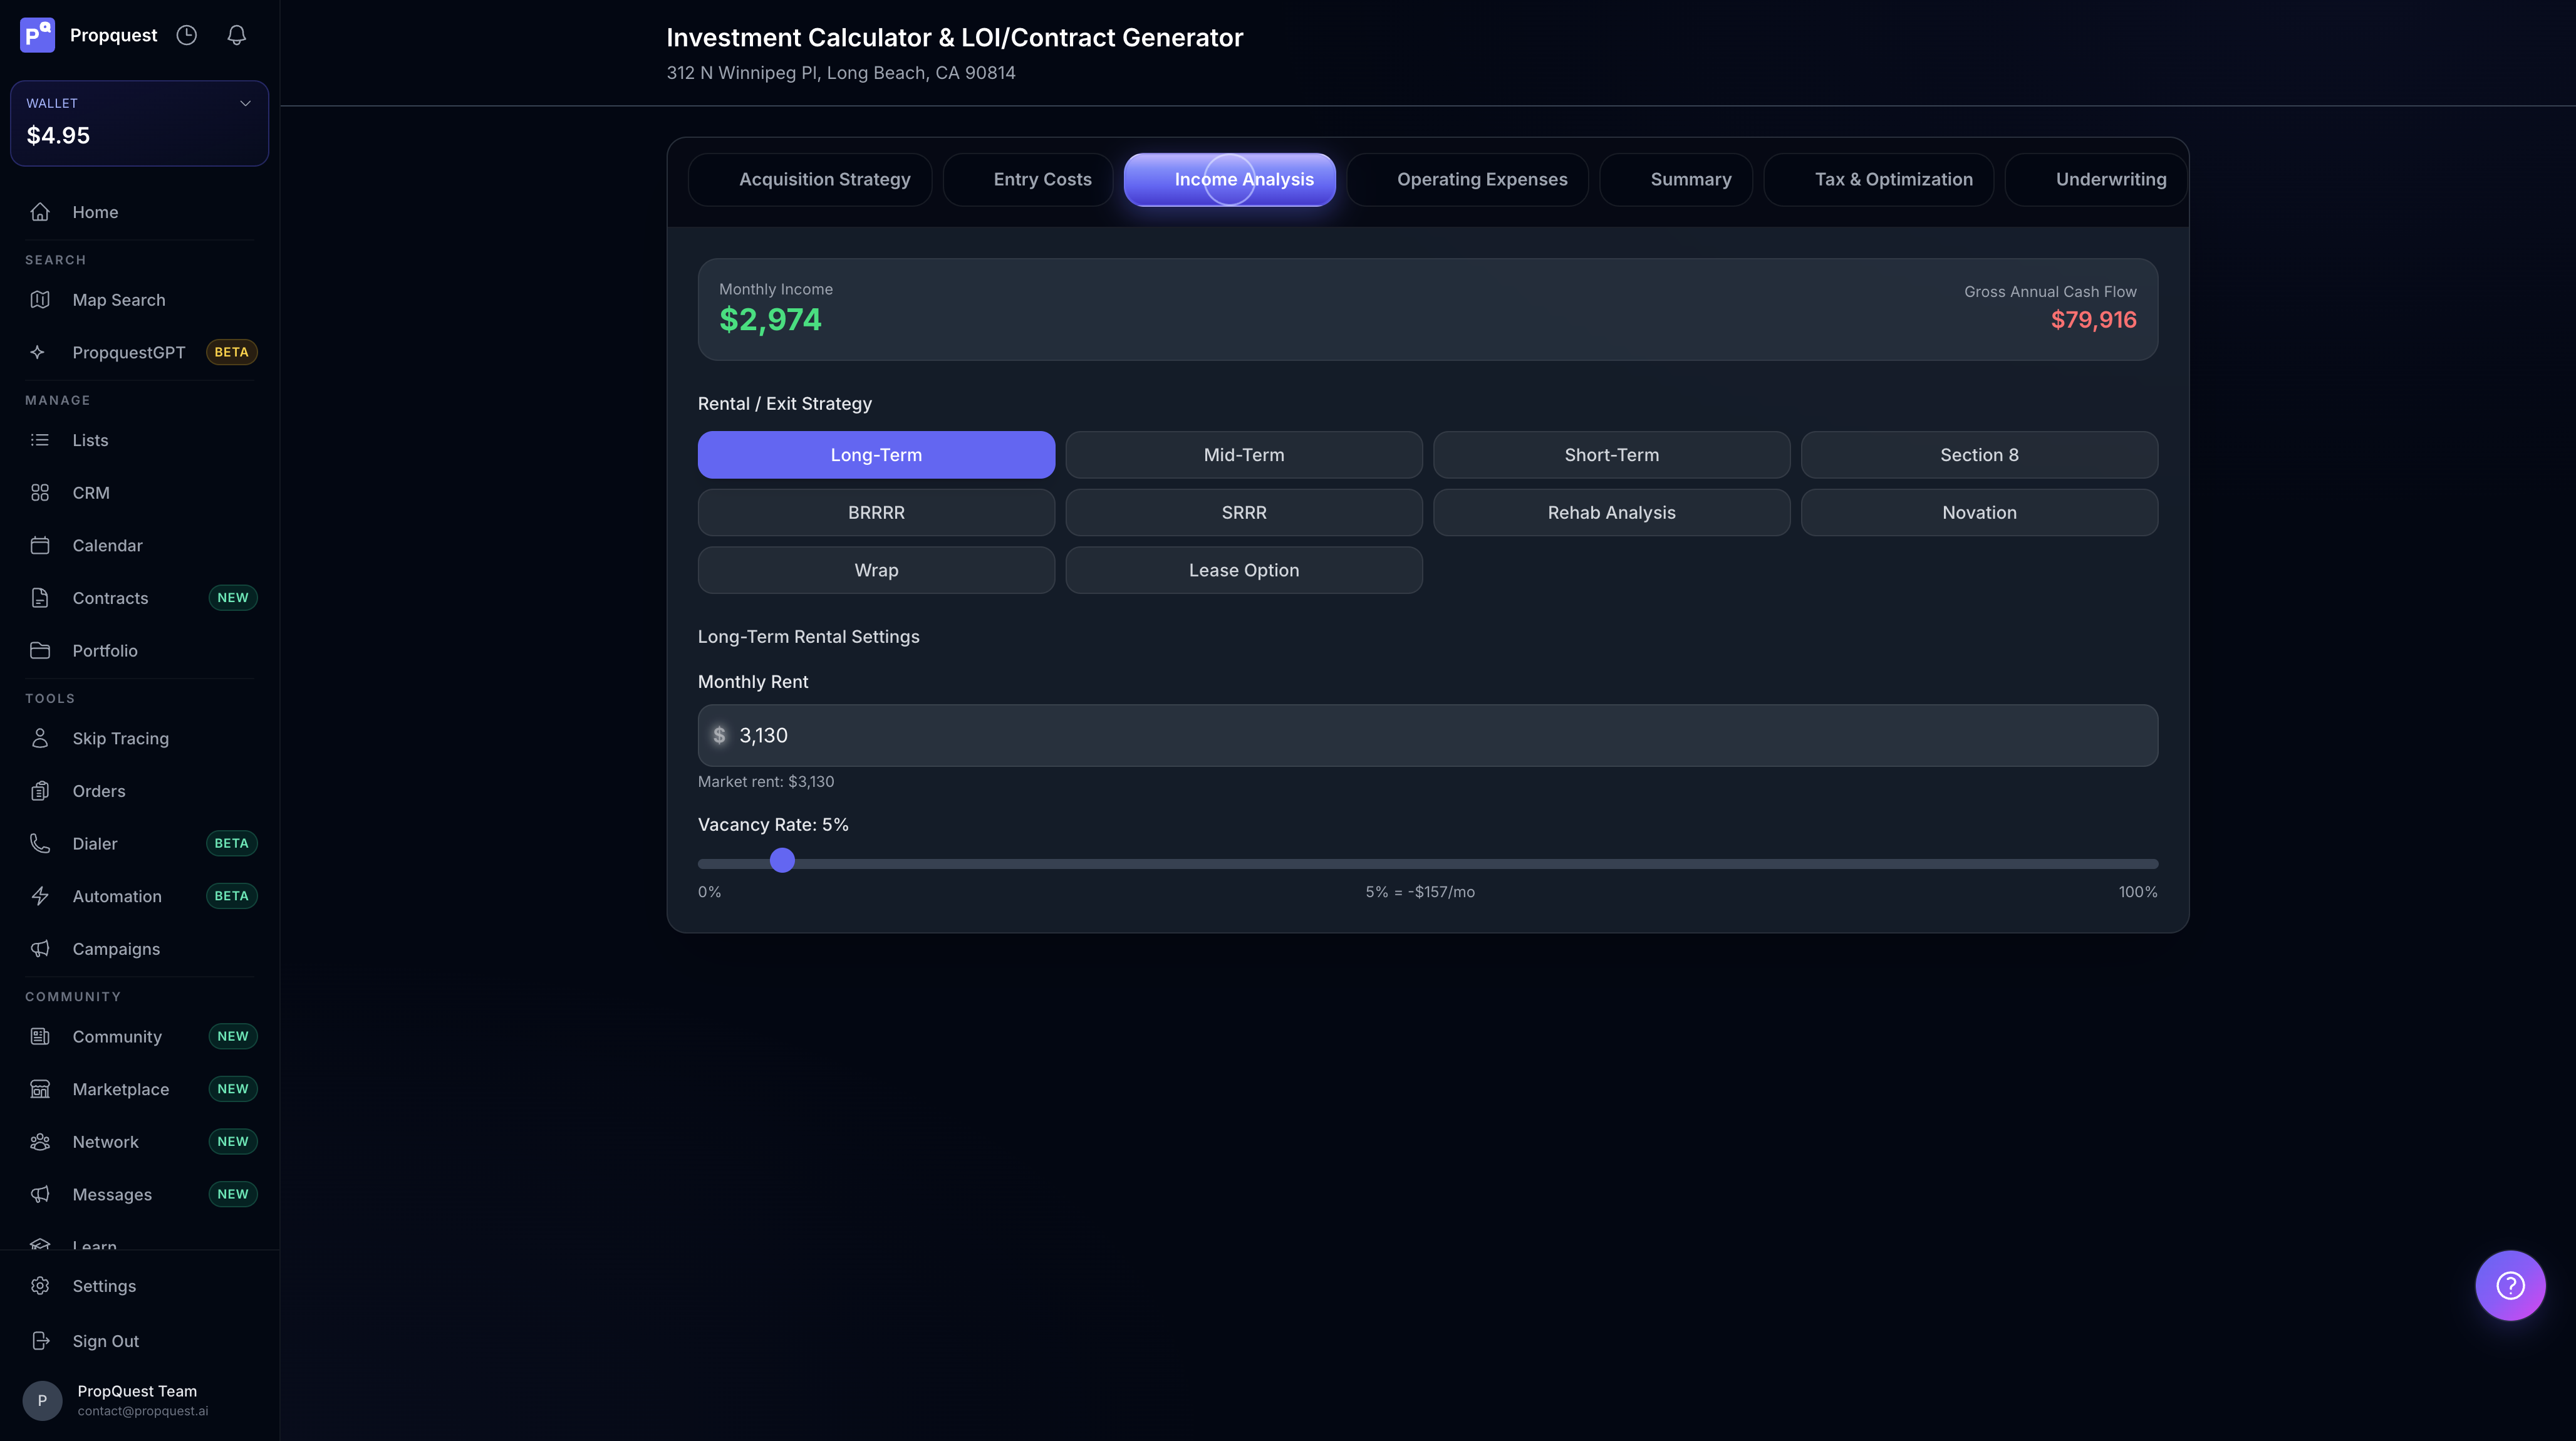
Click a strategy tile and the income inputs rewire. Long-Term Rental pulls suggested rent from the property's rental comp data (visible right under the input as "Market rent: $3,130"). Short-Term Rental asks about nightly rate + occupancy. Section 8 uses the FMR for your bedroom count. BRRRR assumes refi-and-pull-cash so the operating income only matters post-refi. Novation and Lease Option zero out monthly rent in favor of a one-time fee.
The Vacancy Rate slider next to monthly rent is the one investors over-optimize. Default is 5% — that's already optimistic for most markets. Bump it to 8-10% if the area has high tenant turnover or you're new to property management; the modest haircut is the difference between a pro forma that survives reality and one that doesn't.
Operating expenses — the section that humbles spreadsheets
The Operating Expenses tab separates Fixed Costs (property tax, insurance, HOA, utilities — flat dollar amounts) from Variable Costs (maintenance, property management, CapEx reserves — % sliders). The split matters because the variables are the ones investors zero out to make a deal look good and then get murdered by in year three.
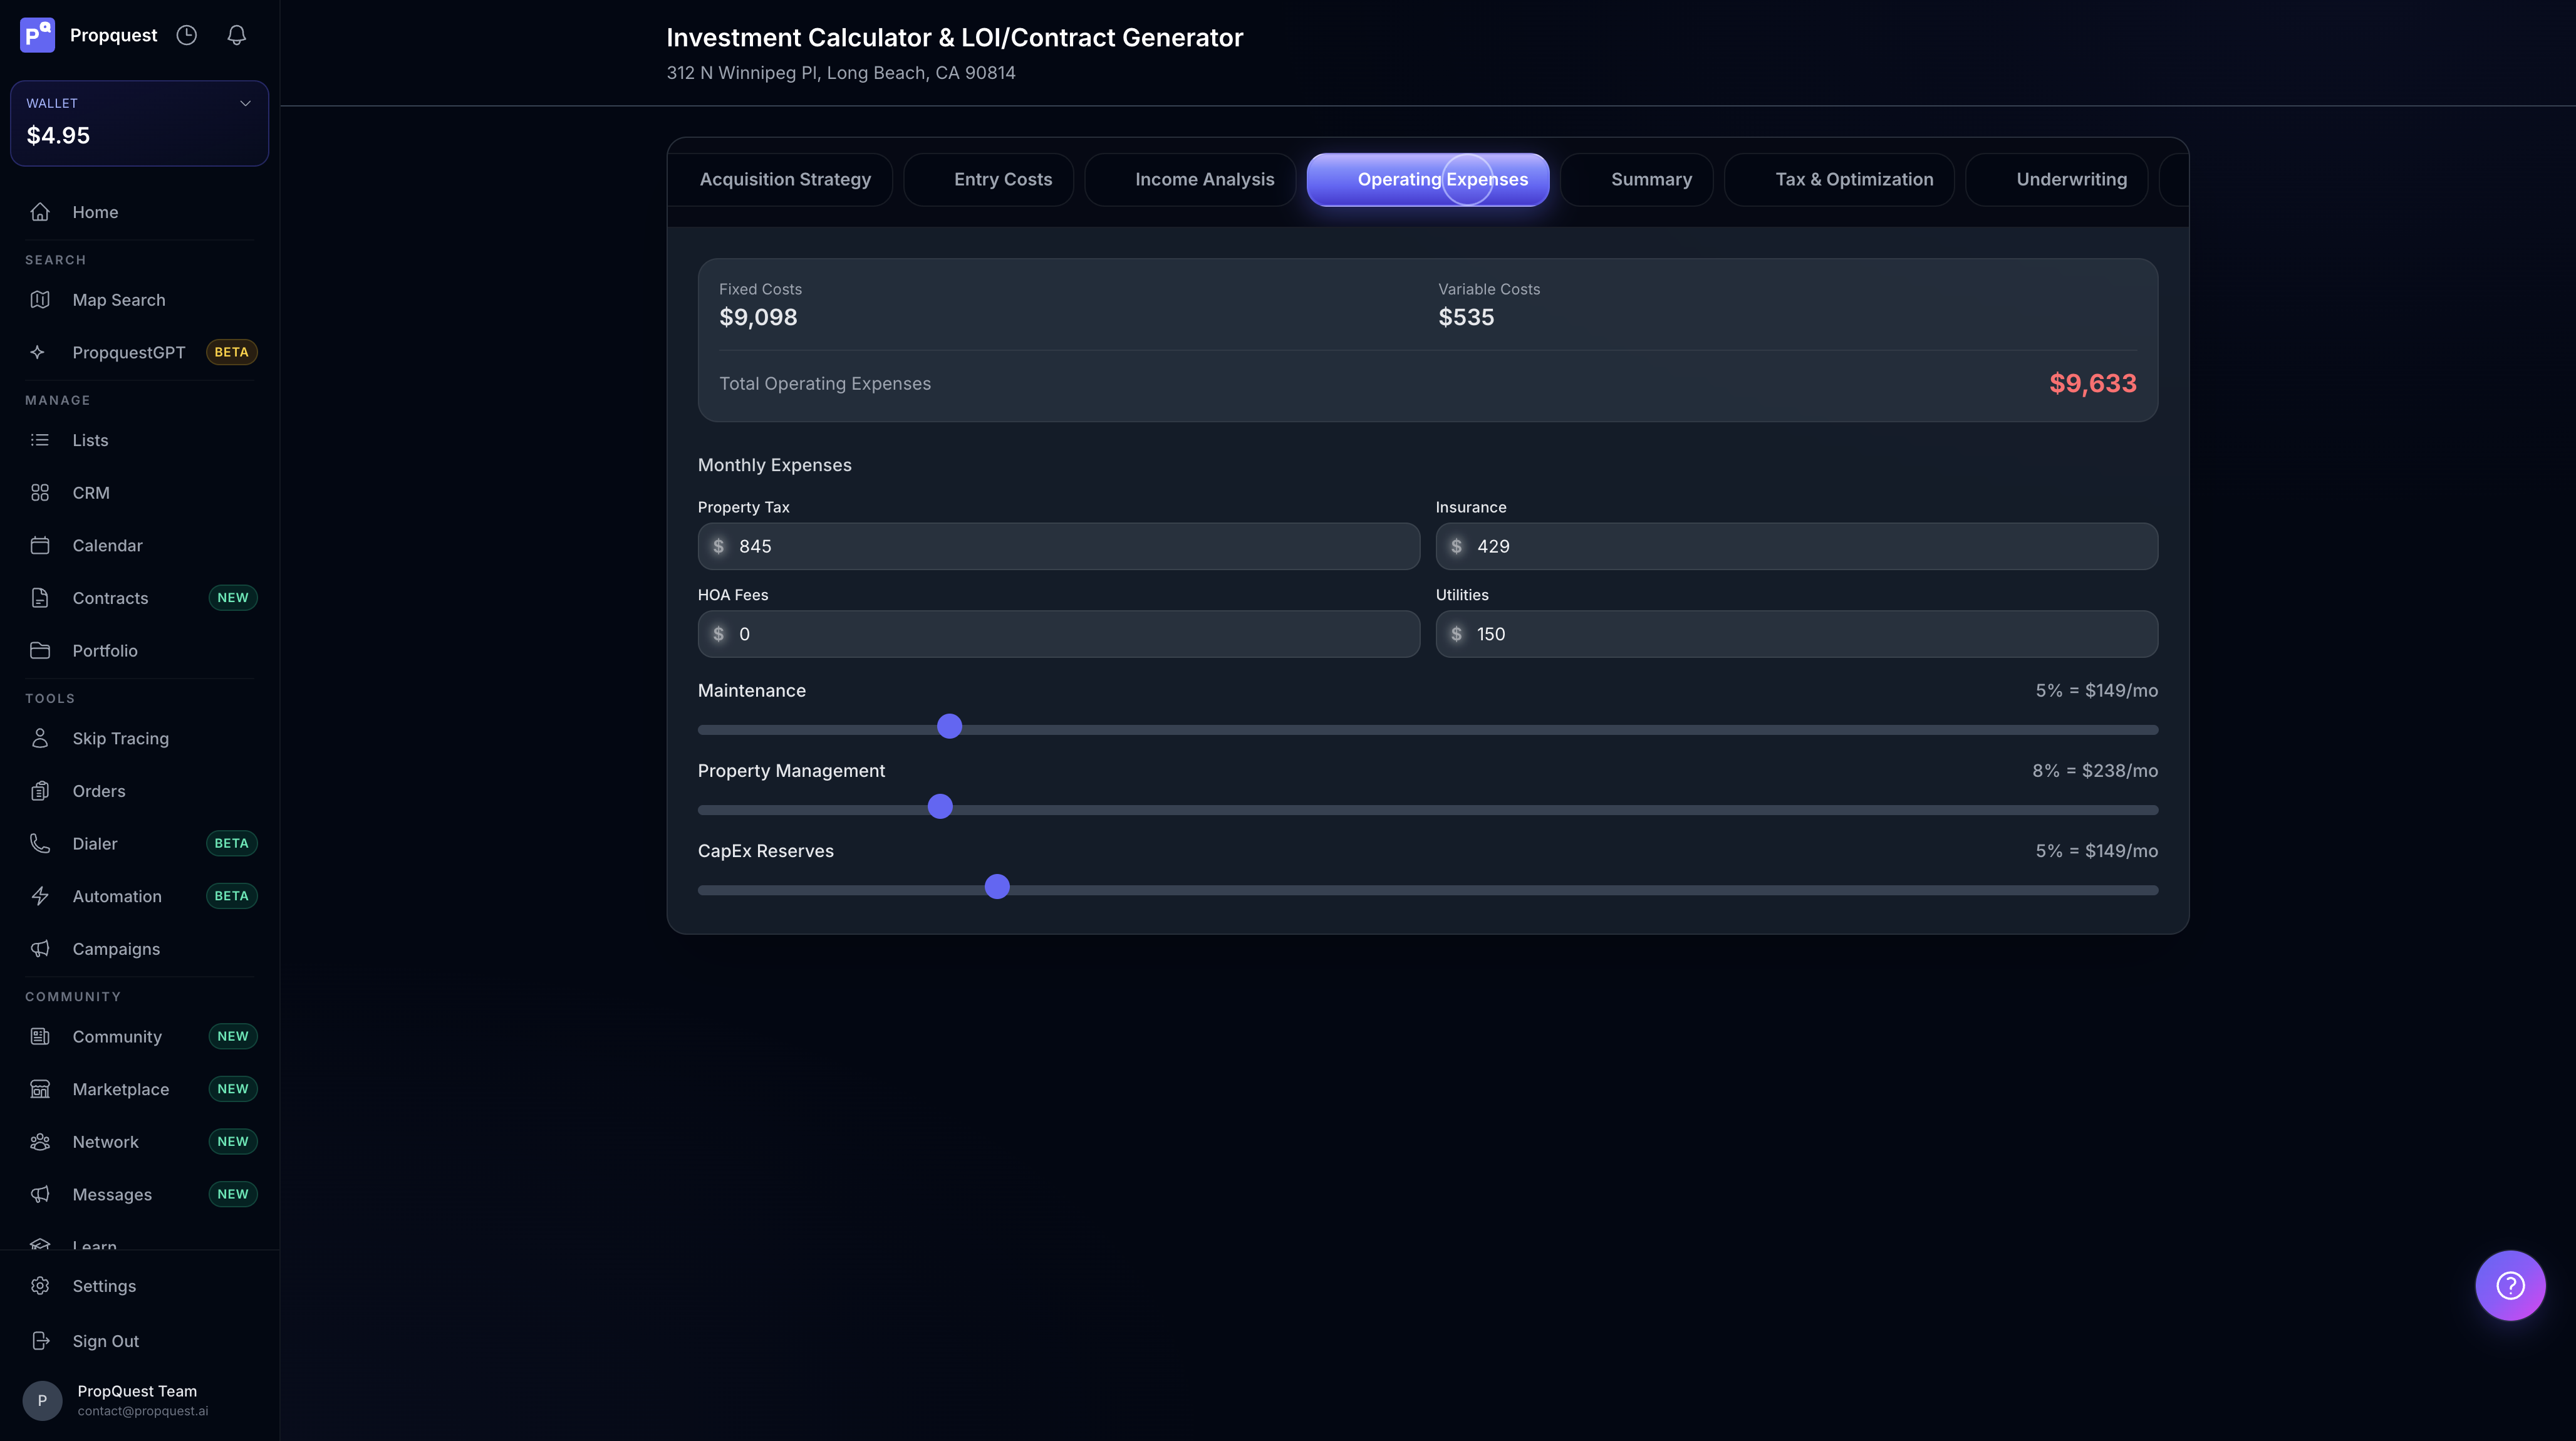
Defaults that ship are reasonable but conservative-optimistic: 5% maintenance, 8% property management, 5% CapEx. If you're self-managing, you can drop PM to 0 — but then add the hours you spend dealing with tenants somewhere mentally, because the deal IS costing you that time. CapEx at 5% is fine for a property in good shape; bump to 10-12% on anything pre-1960 or with deferred maintenance. The slider tells you the dollar amount as you drag — pay attention to it, not just the %.
The Summary tab is where the deal gets graded
This is the page the rest of the analyzer feeds into. The Summary tab shows your selected strategy's headline metrics, a star-based Deal Rating, and — the killer feature — an All Strategies Comparison table that runs the math for every exit strategy at once so you can see which one this property actually wants to be.
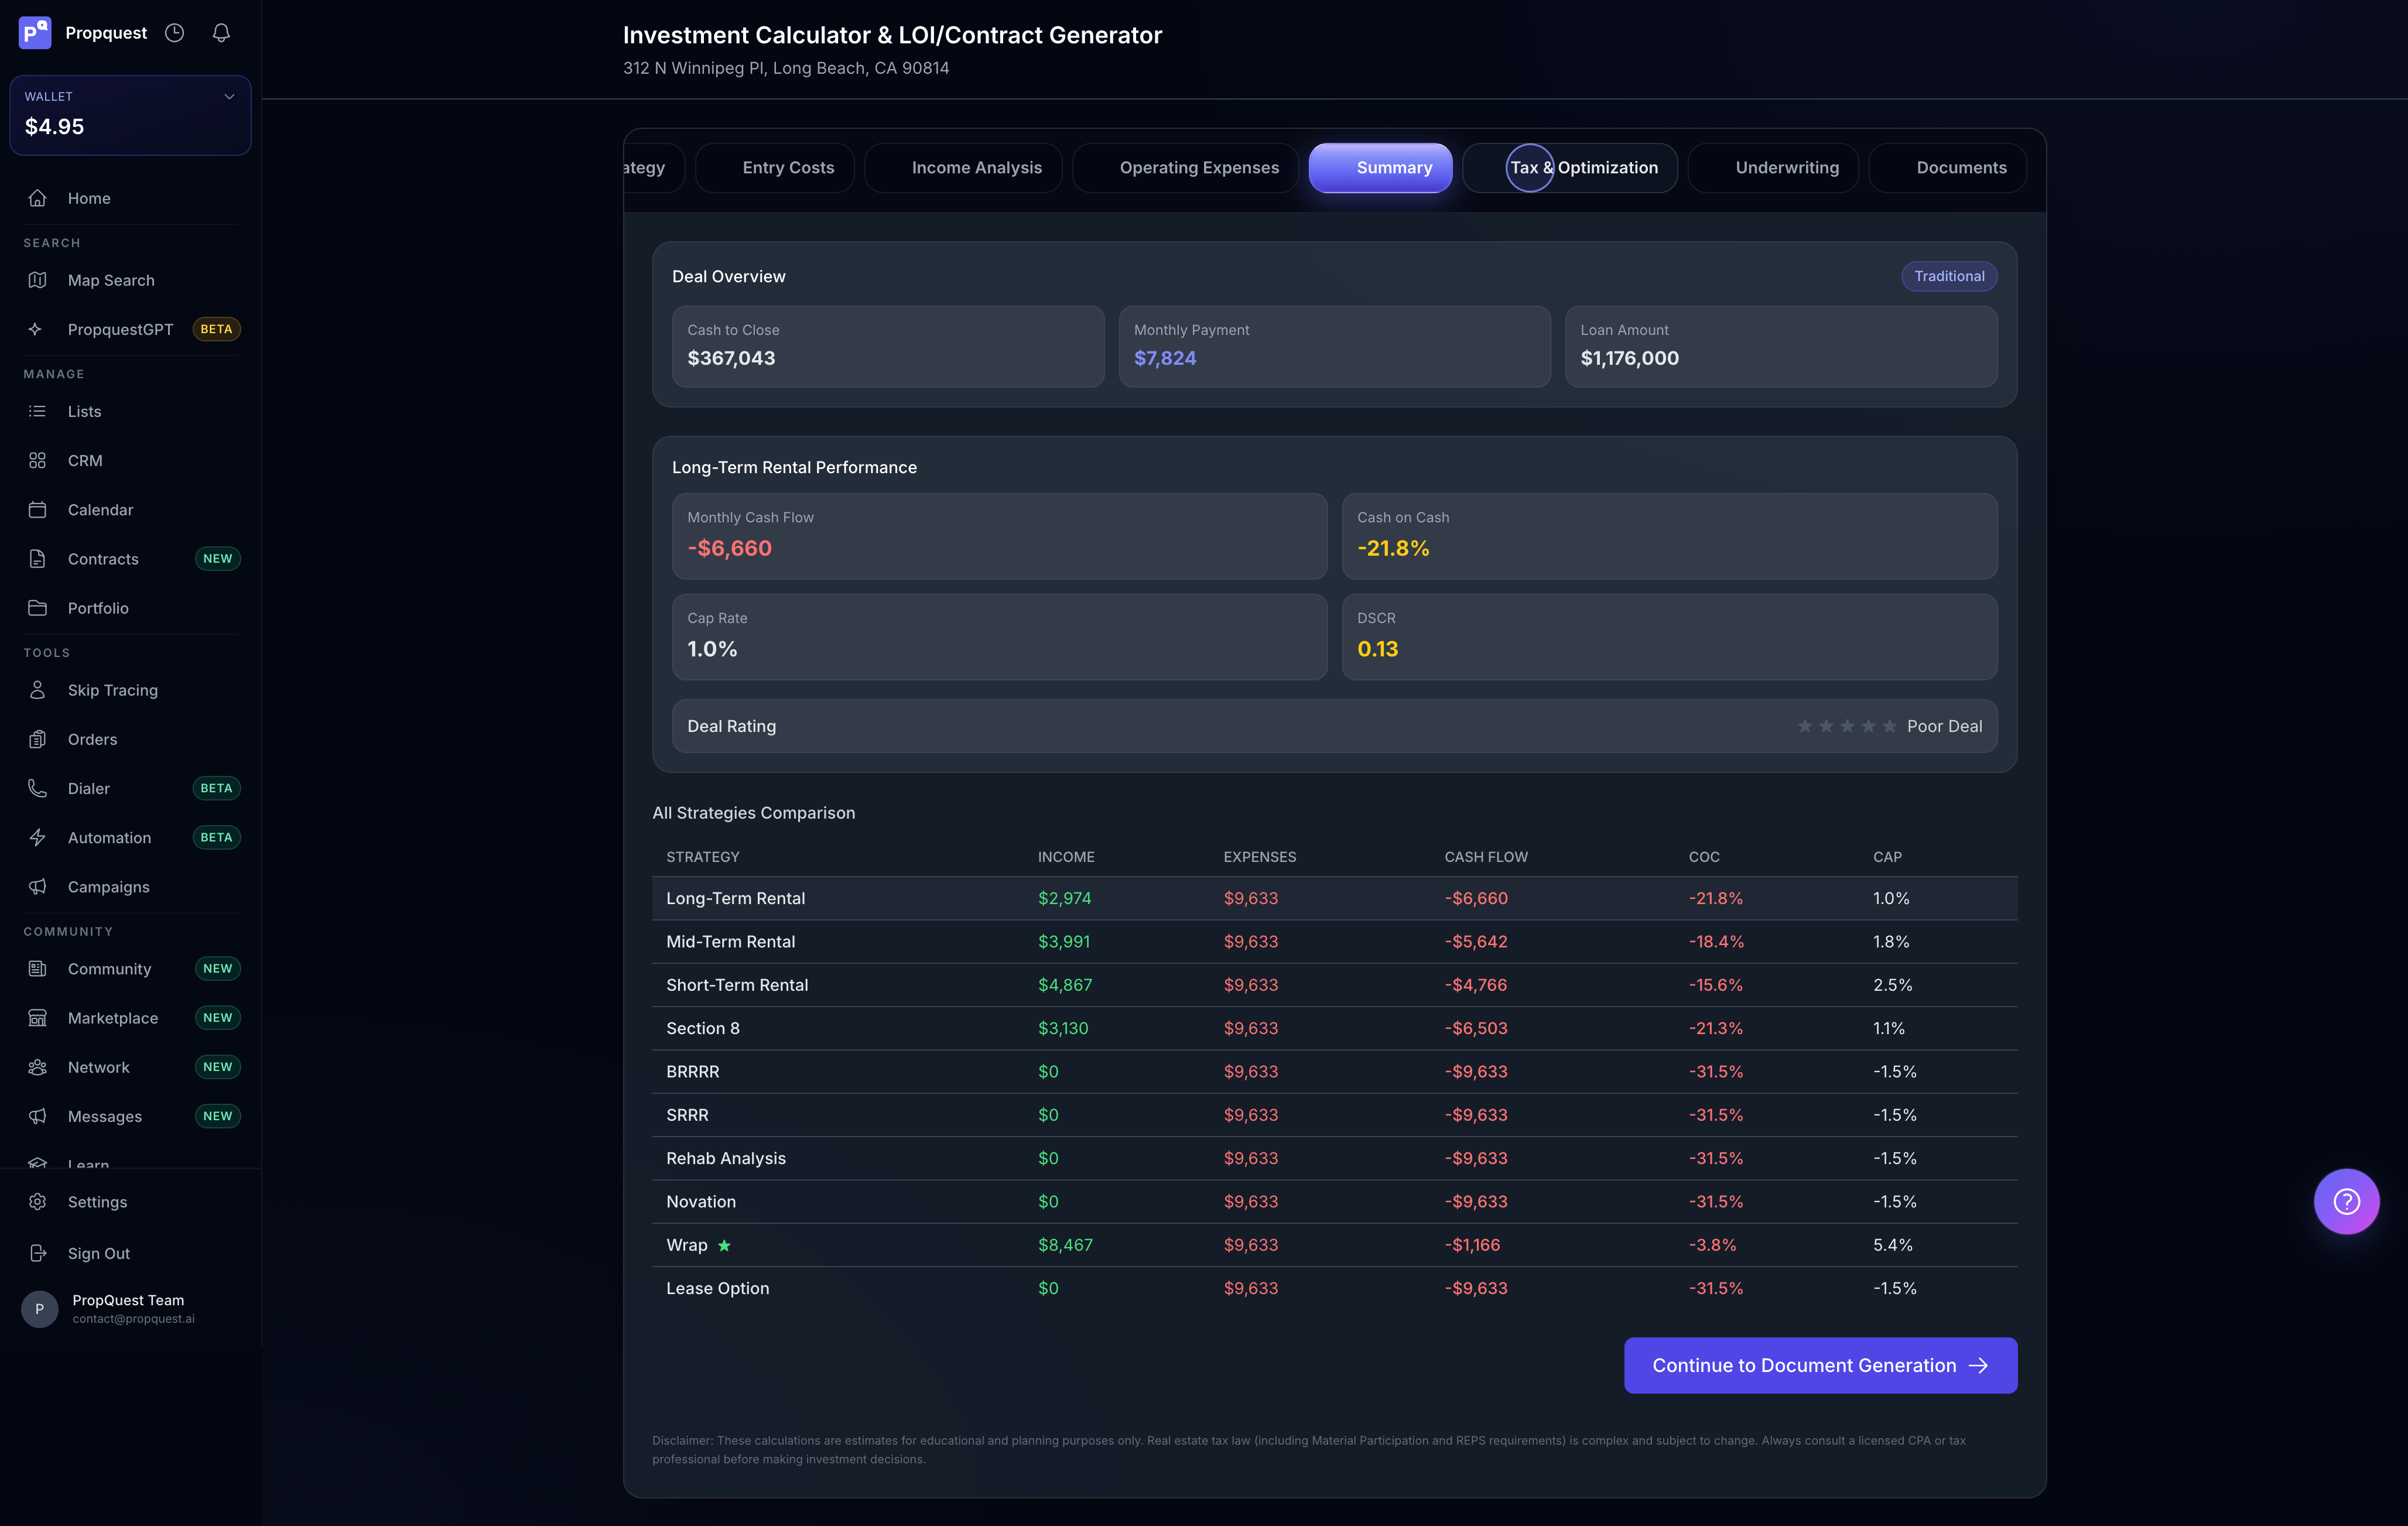
The Deal Rating gives you a 1-5 star verdict at a glance. The reasoning is non-obvious: a 1-star rating doesn't mean walk away — it means the strategy you picked doesn't fit. The comparison table tells you which strategy DOES fit. On the Long Beach deal in the screenshot, every strategy goes negative cash flow at the asking price — the deal works only if you renegotiate, and the Wrap column is the least-bad starting point because its income column lights up at $8,467/mo.
Use this table as a decision tool, not a vanity check. If wholesale shows a $30k spread and long-term rental shows -$500/mo cash flow, you have a wholesale deal, not a hold deal. If both look negative, you have a "make a different offer" deal. If the only column that works is BRRRR at a 75% LTV refi, you have a BRRRR deal — and your offer math should anchor on that.
The Continue to Document Generation button at the bottom is the bridge to the contract. You can also use the tabs at the top to jump to Tax & Optimization for after-tax modeling, or Underwriting if you're wholesaling and need to model end-buyer terms.
Tax & Optimization — the line most pro formas skip
This is the tab that separates the "spreadsheet investors" from the people who actually keep what they earn. Set your Effective Tax Rate (federal + state combined), your Land Value Allocation (typically 15-25% — land doesn't depreciate), then check the tax strategies you're applying.
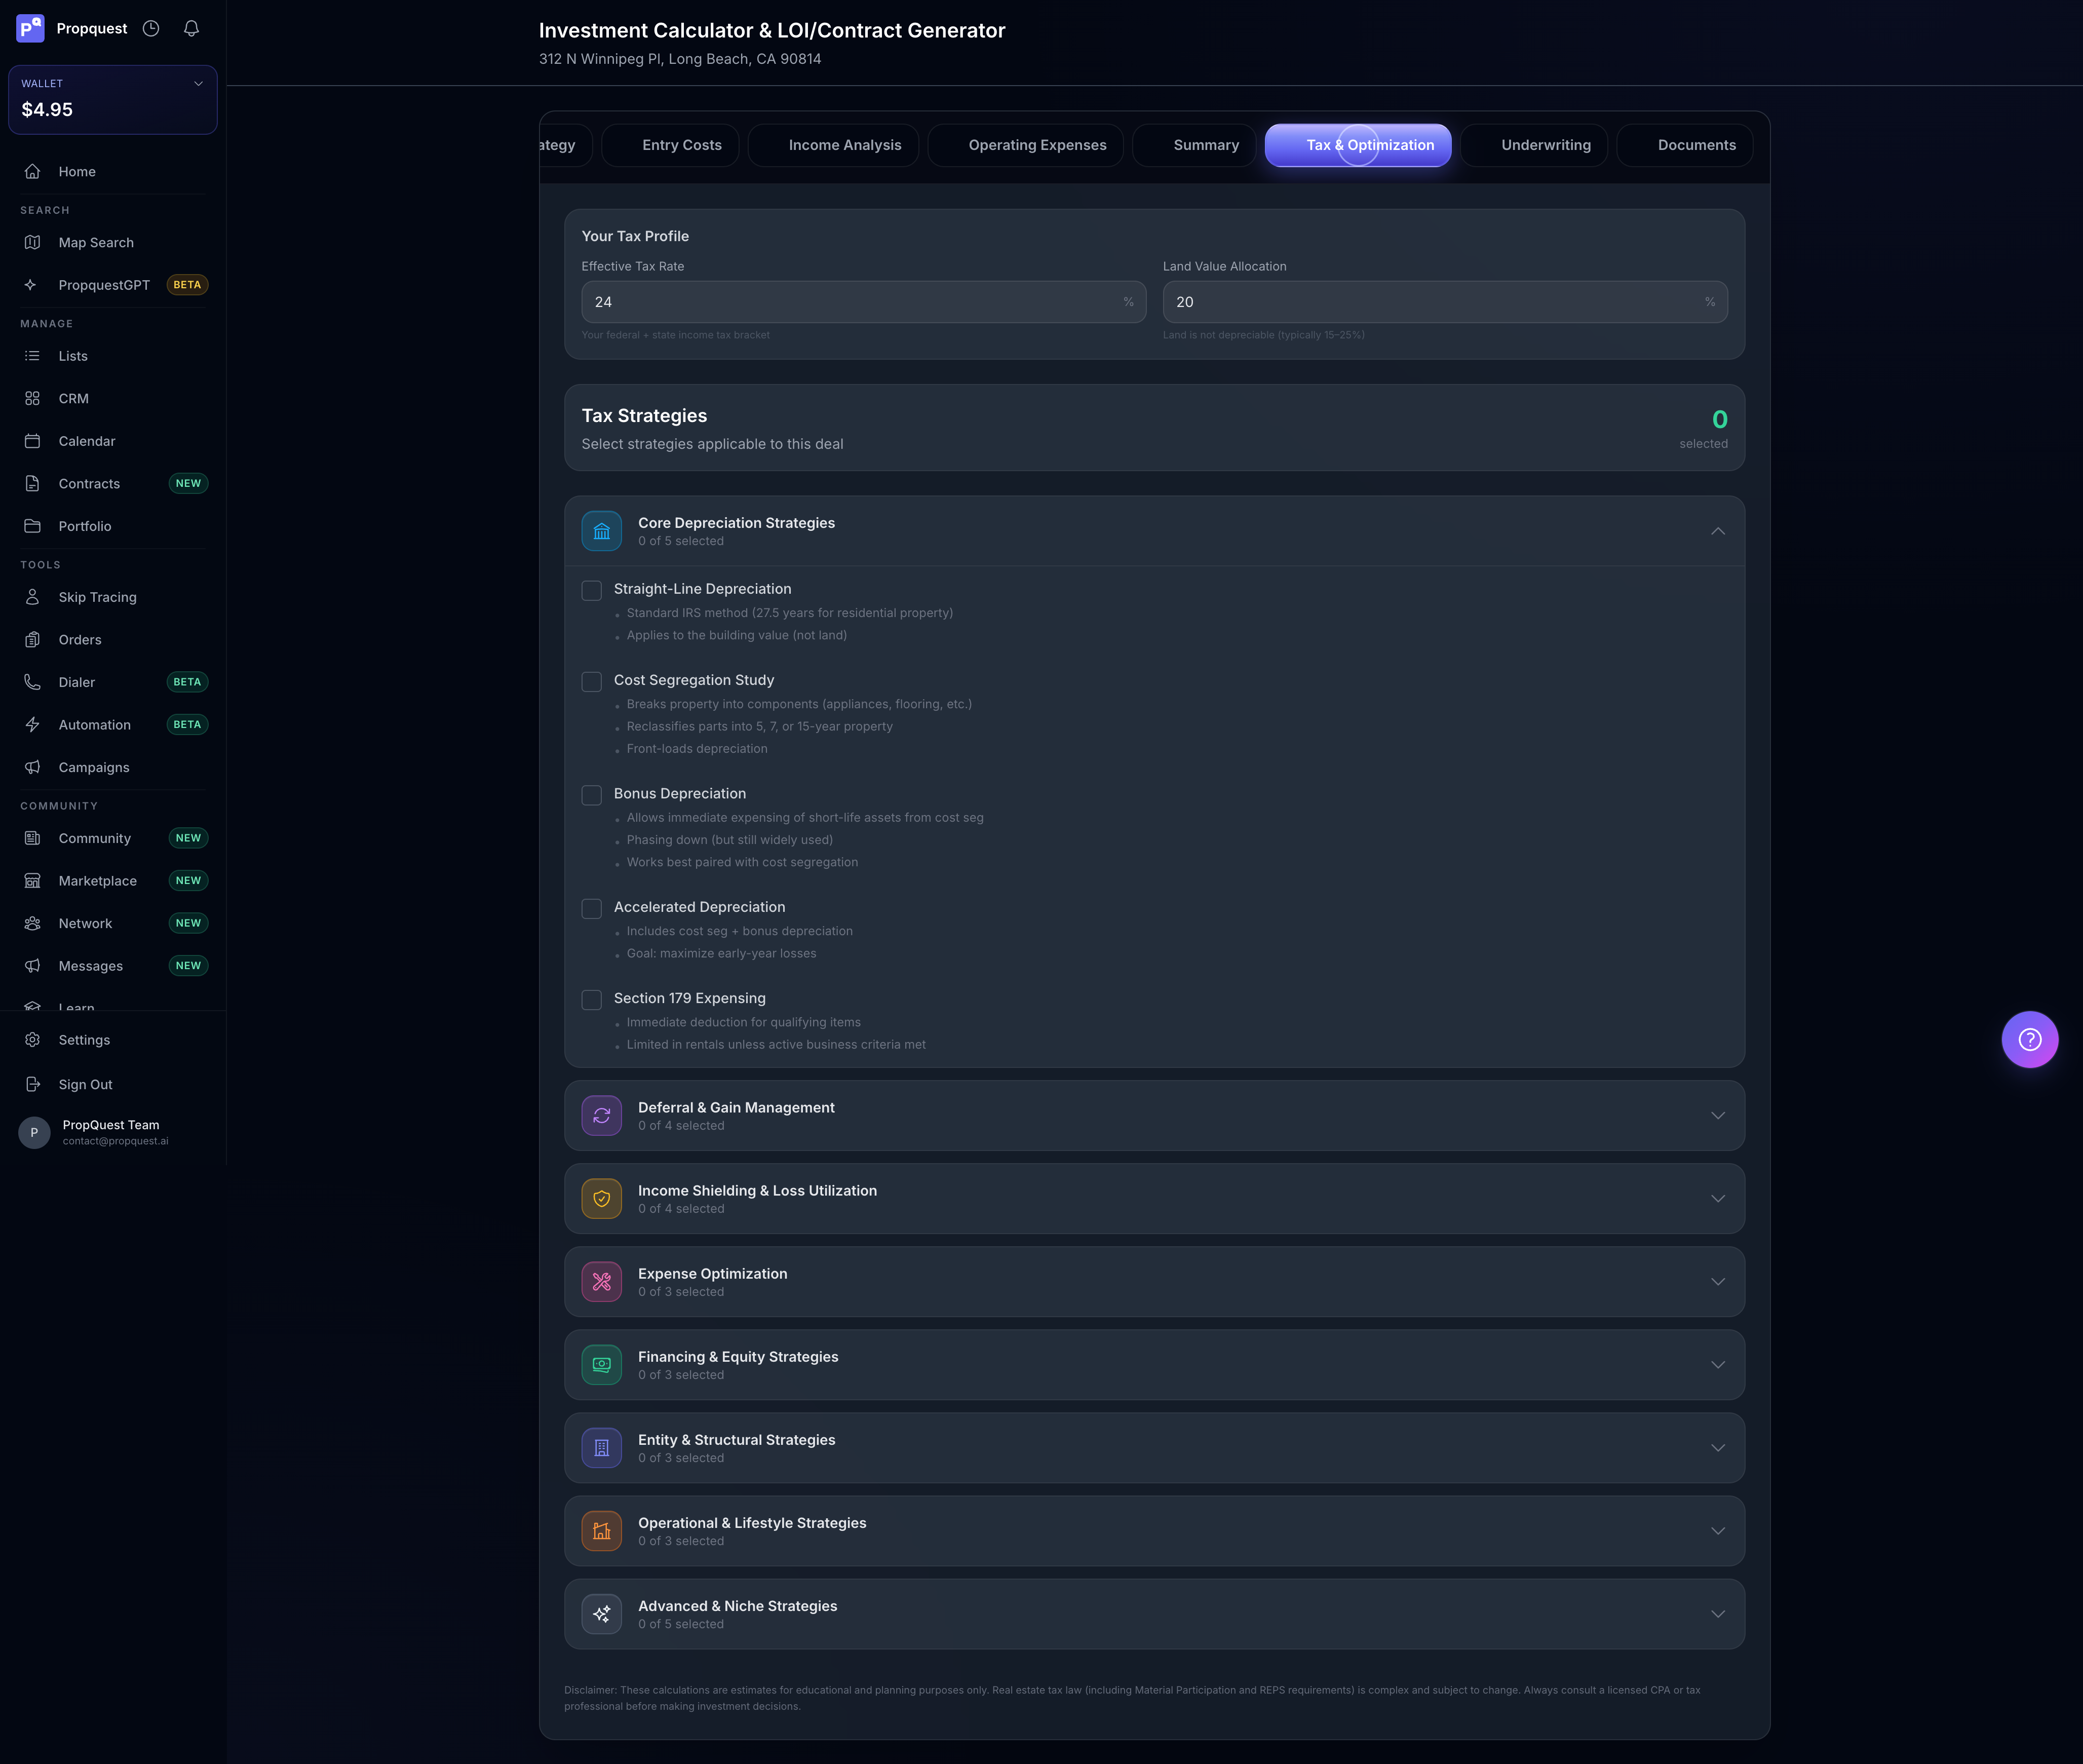
Eight strategy groups: Core Depreciation (straight-line, cost seg, bonus, accelerated, Section 179), Deferral & Gain Management (1031, opportunity zones), Income Shielding & Loss Utilization (REPS, material participation), Expense Optimization, Financing & Equity, Entity & Structural, Operational & Lifestyle, Advanced & Niche. Each one toggles into the after-tax cash flow model.
The biggest lever for most rental investors is Cost Segregation + Bonus Depreciation — front-loads 20-30% of building basis into year-one deductions, which (combined with material participation or REPS status) can offset other active income. The disclaimer is real though: this is genuinely complex tax law, the IRS scrutinizes it, and you need a CPA who's done it before signing anything. The analyzer's job is to surface the upside so you can have an intelligent conversation with your CPA — not to be your CPA.
Underwriting — wholesale scenario modeling
If your exit is wholesale or assignment, the Underwriting tab is where you model the end buyer's economics so your offer makes sense to them. EMD source (own cash vs transactional lender), funding source for the cash-to-close (own / PML / hard money), assignment fee, and a full Cash-Out-of-Pocket / Cost of Money / Projected Profit / ROI breakdown.
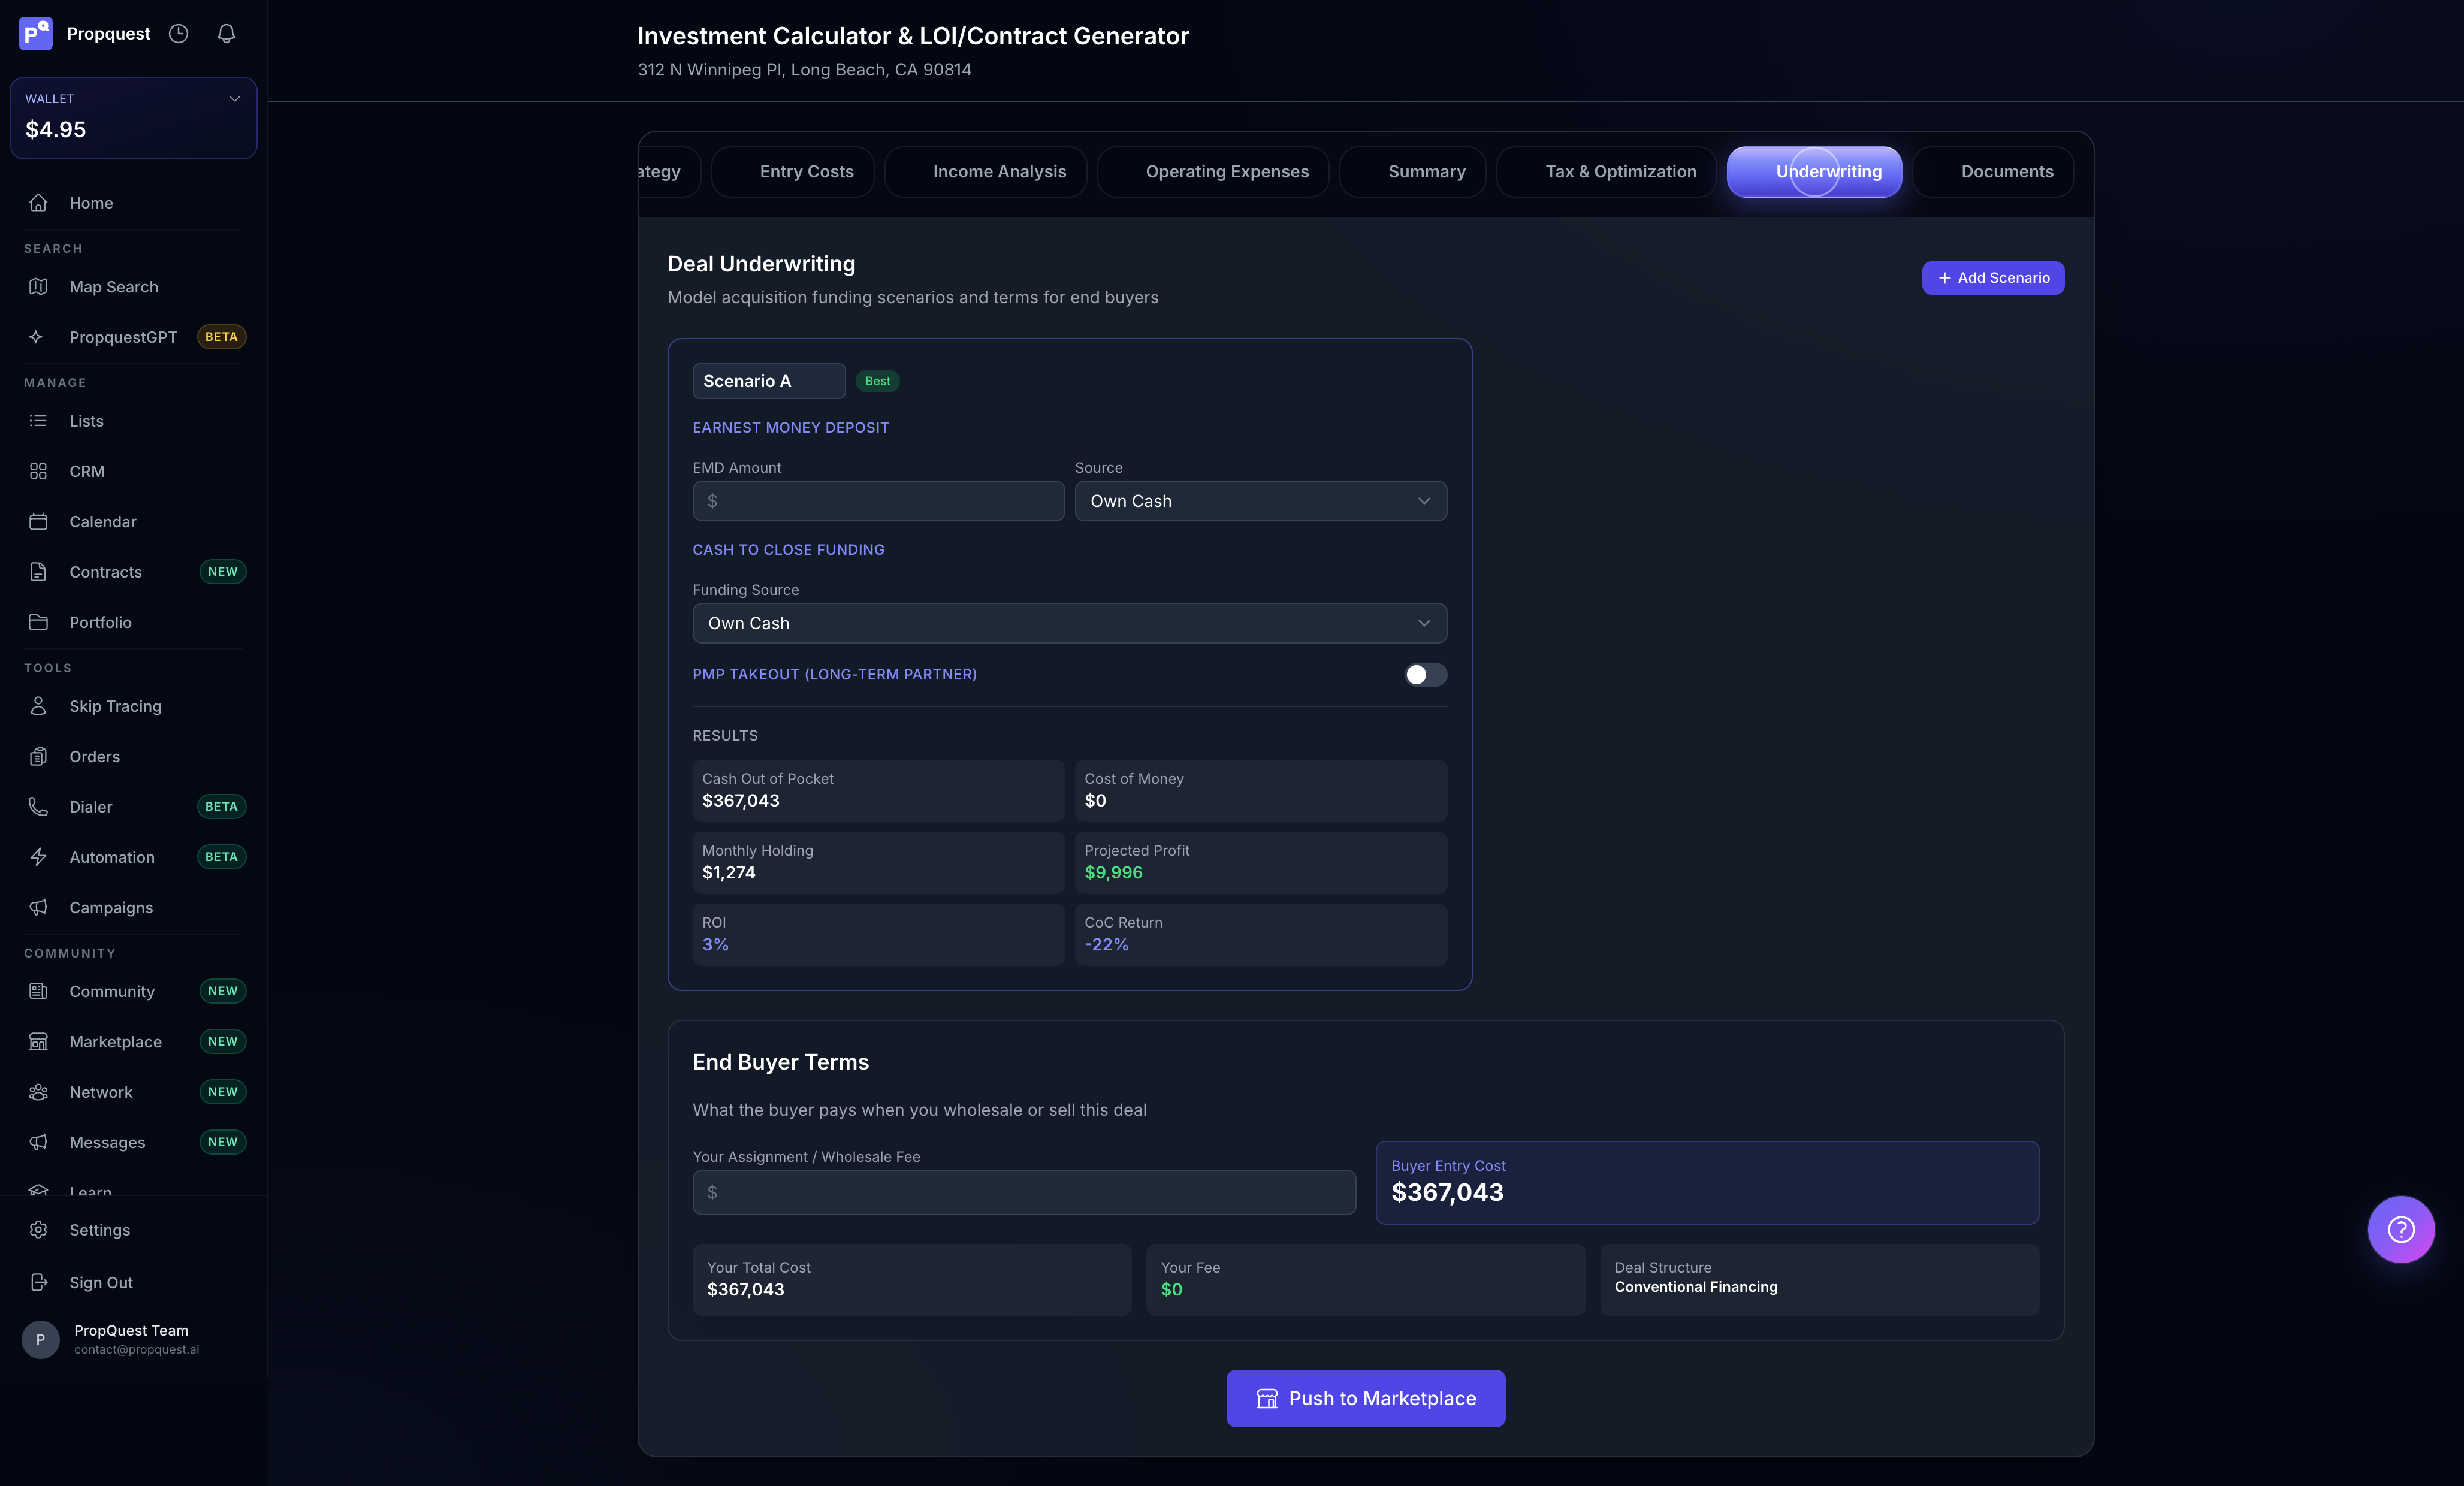
The End Buyer Terms section is the part most wholesalers skip and shouldn't. It computes what your buyer is signing up for — their entry cost, their financing structure, your fee. If those numbers don't make sense for a real buyer, the wholesale won't close even if you get the seller signed up. The Push to Marketplace button at the bottom posts the deal to the PropQuest marketplace for verified buyers to see, with your underwriting math attached.
You can stack multiple scenarios with Add Scenario at the top — model "best case with own cash" alongside "with transactional lender" alongside "with PML" and compare side-by-side. The one marked Best is the analyzer's pick based on projected profit and ROI.
Documents — the contract handoff
Final tab. This is where the analysis becomes a signable document. The Documents tab pre-fills everything from the analysis you just ran: offer price, cash to close, down payment, cash flow, cash-on-cash, seller name (from the property's public records), recommended earnest money at 1% of offer price, your acquisition terms (down %, loan amount, interest rate, term, monthly P&I).
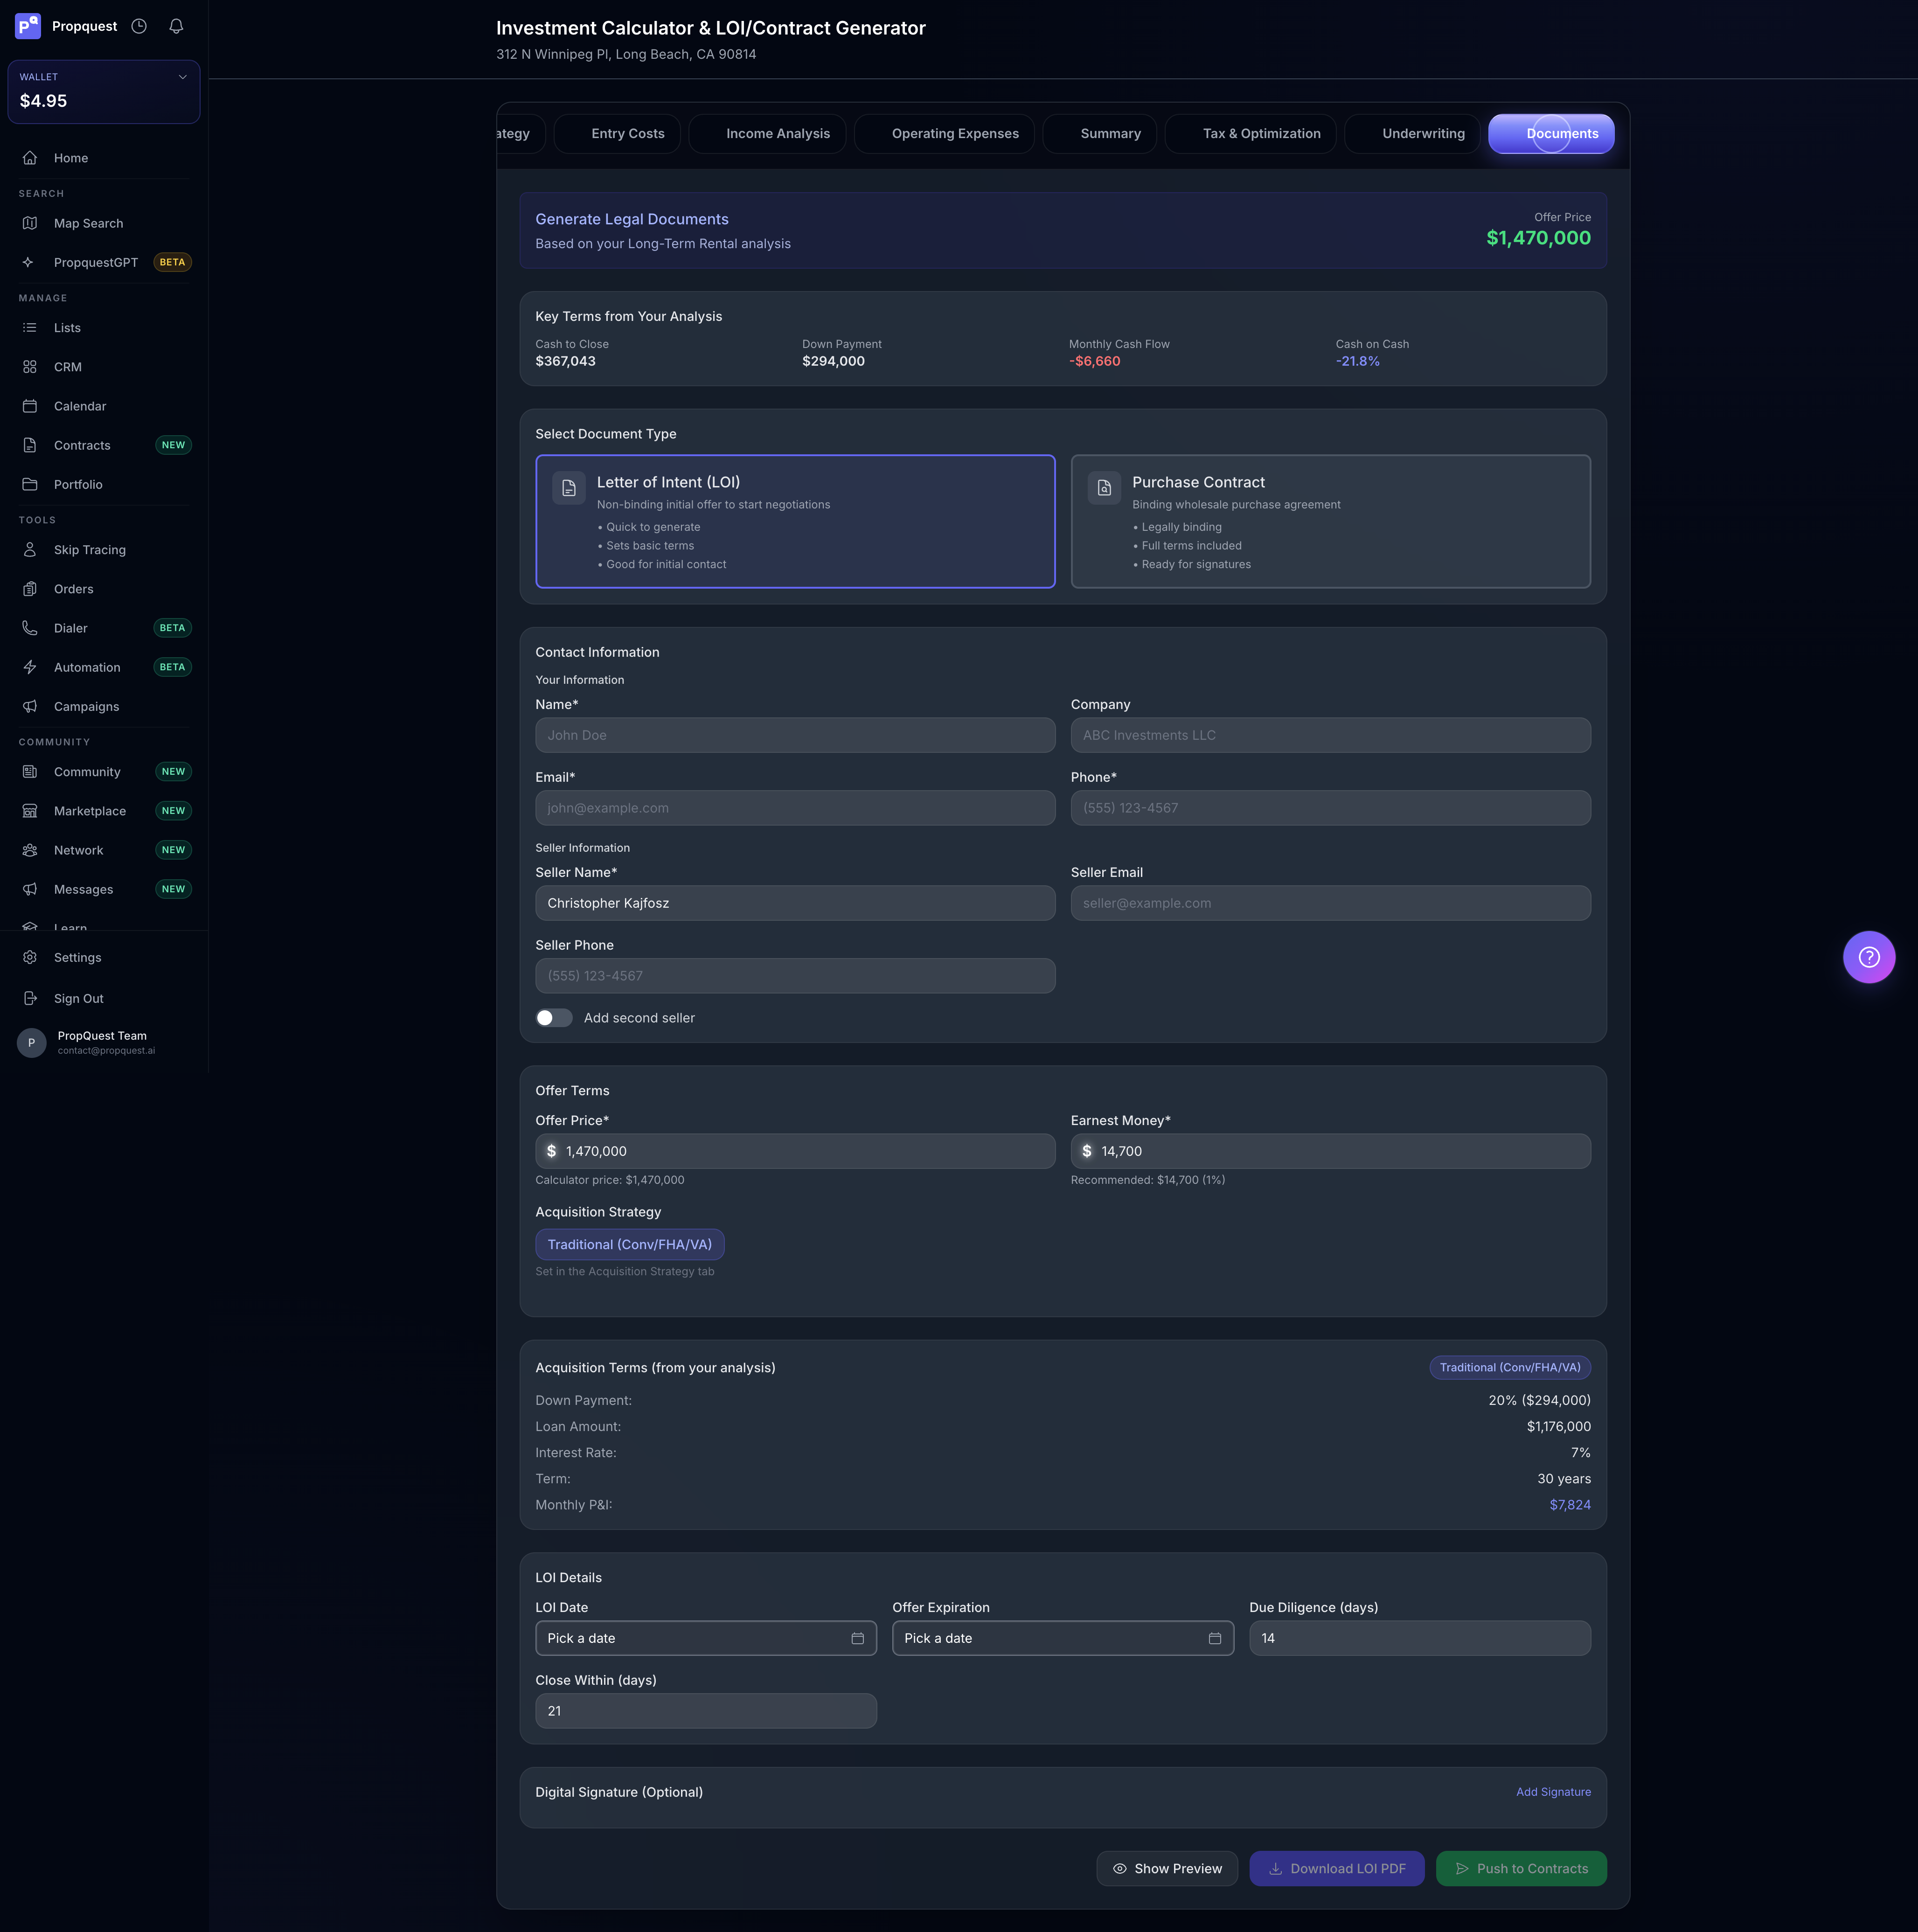
Two document types: Letter of Intent (LOI) for non-binding initial offers (faster, sets terms, good for cold outreach) and Purchase Contract for binding agreements (full terms, ready for signatures, what you send after the seller responds positively to the LOI). Fill in your contact info (saves to your profile after the first time), confirm the seller's, set the offer-expiration and close-within dates, add your digital signature, and hit Download LOI PDF for a one-page summary or Push to Contracts to send it to the Contracts module for e-signature workflow.
The point is: you started this session with a property you'd never heard of and you're ending it with a contract that has every number you just calculated baked in. No spreadsheet. No Word template. No re-typing.
Why this exists
Most underwriting tools stop at "here's your cash-on-cash" and leave you to assemble the contract elsewhere. Most contract generators have no idea what your underwriting said. The Deal Analyzer collapses both into one surface because that's the actual workflow — cold lead, run the numbers, make an offer.
When you get fast at this, the time from "I see a property" to "I have a signed LOI in the seller's inbox" should be five minutes. That's the design goal. Pick the right acquisition strategy, let entry costs auto-compute, pick the exit, watch the all-strategy table tell you which exit fits, generate the document, send it. Five minutes. Every time. That's what most operators stuck in spreadsheet hell think is impossible — and it's the whole reason this tool exists.